
The ability to reverse engineer binaries is extremely important in many settings. Whether analyzing malware (or writing malware…), delving into undocumented APIs, or even just for fun, you will not have the source available. Any kind of thorough reversing effort will invariably involve staring at lots of assembly (or perhaps Java bytecode/.NET IL for managed code).
There are three kinds of reverse engineering analysis:
- Static analysis involves analysis of the contents of the binary file. This entails determining structure of the executable portions (typically manifested in lots of assembly) and printing out readable portions for hints about the program’s purpose.
- Dynamic analysis involves executing the binary (perhaps attaching a debugger) to ascertain what the binary’s intended purpose is, how it does it, etc.
- Hybrid analysis is a mixture of the two. Iterating between static analysis of a codepath, followed by a detailed debugging (or vice versa!) can often lend insights greater than could be obtained by either alone.
A Simple Binary
We’ll be using this simple binary (SHA256 checksum is 0f838dbf8adc7ec7a937842ed26b0746c6699770eb3160868985feba2858599f). I’ve put the source at the end of the file (in the Source section).
Strings
One basic item of static analysis we can perform on a binary is to “run strings” on it. The Strings program, available for free as part of the Sysinternals suite of tools, dumps out all of the–you guessed it–strings that appear in the binary. Install Sysinternals and put it into your path. Navigate to the directory of the binary, and issue the command:
strings --help
The following helpful prompt is given in response:
Usage: strings [option(s)] [file(s)]
 Display printable strings in [file(s)] (stdin by default)
 The options are:
  -a - --all                Scan the entire file, not just the data section
  -f --print-file-name      Print the name of the file before each string
  -n --bytes=[number]       Locate & print any NUL-terminated sequence of at
  -<number>                   least [number] characters (default 4).
  -t --radix={o,d,x}        Print the location of the string in base 8, 10 or 16
  -o                        An alias for --radix=o
  -T --target=<BFDNAME>     Specify the binary file format
  -e --encoding={s,S,b,l,B,L} Select character size and endianness:
			    s = 7-bit, S = 8-bit, {b,l} = 16-bit, {B,L} = 32-bit
  @<file>                   Read options from <file>
  -h --help                 Display this information
  -v -V --version           Print the program's version number
strings: supported targets: ...
Report bugs to <https://www.sourceware.org/bugzilla/>
Let’s give the defaults a try:
strings reversing-demo.exe
Cutting out some of the unreadable results, we’re left with these:
%c%c%c%c
C:\Users\jalospinoso\ReversingDemo\ConsoleApplication1\Release\ConsoleApplication1.pdb
printf
MSVCR120.dll
_XcptFilter
_amsg_exit
__getmainargs
__set_app_type
exit
_exit
_cexit
_configthreadlocale
__setusermatherr
_initterm_e
_initterm
__initenv
_fmode
_commode
_crt_debugger_hook
__crtUnhandledException
__crtTerminateProcess
?terminate@@YAXXZ
__crtSetUnhandledExceptionFilter
_lock
_unlock
_calloc_crt
__dllonexit
_onexit
_invoke_watson
_controlfp_s
_except_handler4_common
EncodePointer
IsDebuggerPresent
IsProcessorFeaturePresent
QueryPerformanceCounter
GetCurrentProcessId
GetCurrentThreadId
GetSystemTimeAsFileTime
DecodePointer
KERNEL32.dll
<?xml version='1.0' encoding='UTF-8' standalone='yes'?>
<assembly xmlns='urn:schemas-microsoft-com:asm.v1' manifestVersion='1.0'>
  <trustInfo xmlns="urn:schemas-microsoft-com:asm.v3">
    <security>
      <requestedPrivileges>
	<requestedExecutionLevel level='asInvoker' uiAccess='false' />
      </requestedPrivileges>
    </security>
  </trustInfo>
</assembly>
We’ve got some embedded information here about some .pdb file. This file, if it were available, would contain formation (like function prototypes) that would make debugging much easier. The binary probably imports the C runtime (which we can tell from MSVCR120.dll), and it was probably compiled with Visual Studio 2013–information we can glean off the 120 version number in the .dll. It looks like the binary calls printf, but we can’t really infer much more.
Dumpbin
We can confirm our suspicions about what functions the file calls with the Dumpbin utility, which is available as part of Microsoft Visual C++ (you can obtain this e.g. by installing Visual Studio 2013). Once you have it installed (one way or another), you can put it on your PATH. Mine could be found here:
C:\Program Files (x86)\Microsoft Visual Studio 12.0\VC\bin\dumpbin.exe
Dumpbin is a powerful utility. We’ll use it to view the functions that our binary depends on:
dumpbin /IMPORTS reversing-demo.exe
Here are the results:
Microsoft (R) COFF/PE Dumper Version 12.00.31101.0
Copyright (C) Microsoft Corporation.  All rights reserved.


Dump of file reversing-demo.exe

File Type: EXECUTABLE IMAGE

  Section contains the following imports:

    MSVCR120.dll
		402024 Import Address Table
		4022B4 Import Name Table
		     0 time date stamp
		     0 Index of first forwarder reference

		  1F4 __setusermatherr
		  30D _initterm_e
		  30C _initterm
		  1B7 __initenv
		  2A2 _fmode
		  23F _commode
		  250 _crt_debugger_hook
		  1AC __crtUnhandledException
		  1AB __crtTerminateProcess
		  240 _configthreadlocale
		  135 ?terminate@@YAXXZ
		  1A9 __crtSetUnhandledExceptionFilter
		  394 _lock
		  504 _unlock
		  22E _calloc_crt
		  1AE __dllonexit
		  43A _onexit
		  314 _invoke_watson
		  243 _controlfp_s
		  27A _except_handler4_common
		  22F _cexit
		  283 _exit
		  64E exit
		  1F2 __set_app_type
		  1B6 __getmainargs
		  217 _amsg_exit
		  16B _XcptFilter
		  6FD printf

    KERNEL32.dll
		402000 Import Address Table
		402290 Import Name Table
		     0 time date stamp
		     0 Index of first forwarder reference

		  2D6 GetSystemTimeAsFileTime
		  20E GetCurrentThreadId
		  20A GetCurrentProcessId
		  42D QueryPerformanceCounter
		  36D IsProcessorFeaturePresent
		  367 IsDebuggerPresent
		  121 EncodePointer
		   FE DecodePointer

  Summary

	1000 .data
	1000 .rdata
	1000 .reloc
	1000 .rsrc
	1000 .text
After staring at enough Dumpbin dumps, it might be possible to tease out some unusual functions in here, but it’s tough to say for sure. One thing that does stick out is the printf import.Maybe we can try running the binary to see what happens (although, I totally understand if you wouldn’t want to run it without having comiled it yourself!)
reversing-demo.exe
Nothing seems to have happened. We still really don’t know what our binary is doing.
IDA Free
We’ll be using the free version of the interactive disassembler IDA 5.0 Freeware available here. It turns out that disassembling a binary is pretty complicated, and IDA is widely regarded as the best tool for doing it. After installing the free version, fire it up.
- Click on “New : Disassemble a new file”
- Click “PE Executable” and click “OK”
- Navigate to “reversing-demo.exe” and Open it.
- Let’s use the default options in the wizard. Continue clicking “Next >” until complete.
- As we guessed from the
.pdbfile in Strings, the binary was linked with debug information. Helpfully, a pop-up box confirms this and asks if we have the PDB available. I’ve put the PDB into the links section below, but try reversing without this information first. Click “No” when asked to link in the PDB file.
IDA will do a whole bunch of work at this point trying to disassemble your file.
Let’s do a very quick orientation to IDA. First thing to notice is the slider:

This slider allows you to click into a region of the binary and investigate its contents. For example,
the pink region contains all of the .idata which is PE Format speak for all the imports. You can see function definitions that should correspond with our Dumpbin analysis from earlier (side project: investigate the “Exports” and “Imports” tabs to see if they correspond with the output we found).
Clicking into a blue region navigates us to a .text section that contains all of our executable code (assembly):
You can scroll through this disassembly and, in theory, figure out what’s going on from here. Fortunately, IDA has a graph version of this “IDA View” which can be accessed by pressing the Space bar:
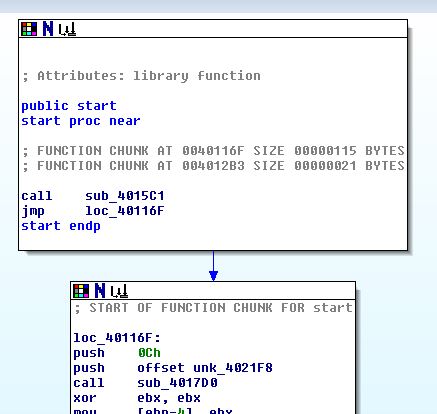
This view is perhaps what IDA is best known for: each block represents a chunk of code, and the lines represent jumps between the code blocks (both conditional and unconditional). This is much, much easier to follow than scrolling through pages and pages of disassembly.
The final window we’ll explore is the strings view:
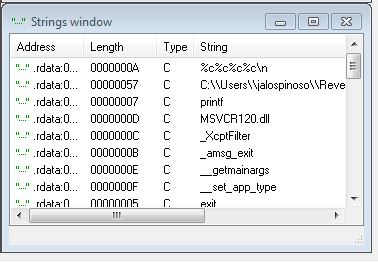
You’ll notice that the output corresponds with what we got from running Strings earlier.
There are a great many ways to start analysis of a binary in IDA, but the most important thing to keep in mind is what your goal is. As you’ll see, this binary is extremely simple–but it would take quite a bit of time to step through the assembly code line-by-line to try to figure out what’s going on.
Well, we ran the binary and nothing happened, but there’s a printf statement that showed up in both Strings and Dumpbin. Take a look at the Strings window and identify the printf line. It should appear at .rdata:0040232A. Let’s have a look at the Imports tab:
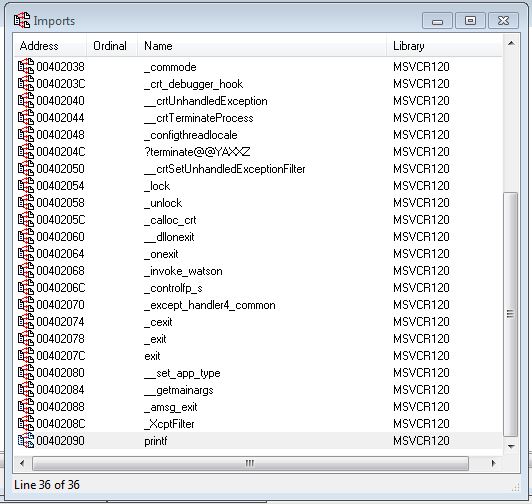
I’ve highlighted the line where printf is imported from MSVCR120.dll. Let’s click on this entry, which brings us into the end of the .idata section:
.idata:00402090 ; int printf(const char *,...)
.idata:00402090                 extrn printf:dword      ; DATA XREF: sub_401000+4Dr
The IDA hotkey x is immensely useful here. We’d like to find out where else in the binary this import is referred to. After clicking on printf, press x:
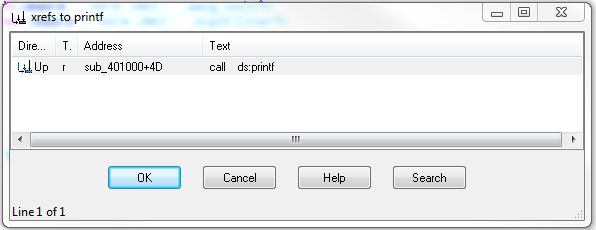
We can see here that printf is referred to one time in a subroutine (sub_401000). Let’s click on it and enter the graph view around this call.
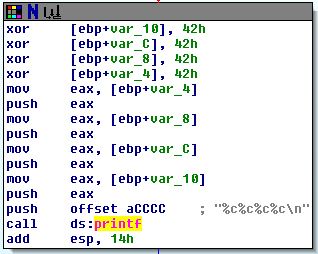
This codepath looks like it is setting up a printf:
mov     eax, [ebp+var_4]
push    eax
mov     eax, [ebp+var_8]
push    eax
mov     eax, [ebp+var_C]
push    eax
mov     eax, [ebp+var_10]
push    eax
push    offset aCCCC    ; "%c%c%c%c\n"
call    ds:printf
Arguments are pushed onto the stack from right-to-left in all modern calling conventions (including __cdecl, usually the calling convention for printf style). We can then see that printf is called with the arguments
printf ("%c%c%c%c\n", [ebp+var_10], [ebp+var_C], [ebp+var_8], [ebp+var_4])
Let’s track these characters throughout the code. ebp is the stack base pointer, and positive offsets are local variables (not hugely important if you are not familiar with how functions are setup in x86 assembly).
IDA helps us out by labeling each of these variables var and their positive offset from ebp (notice they are 4 byte offsets, starting with 4). We can rename these variables throughout the code to help us in our investigation. Simply click a variable, type n and enter a new name. Here, I’ve chosen to name each character by its order in the printf call:
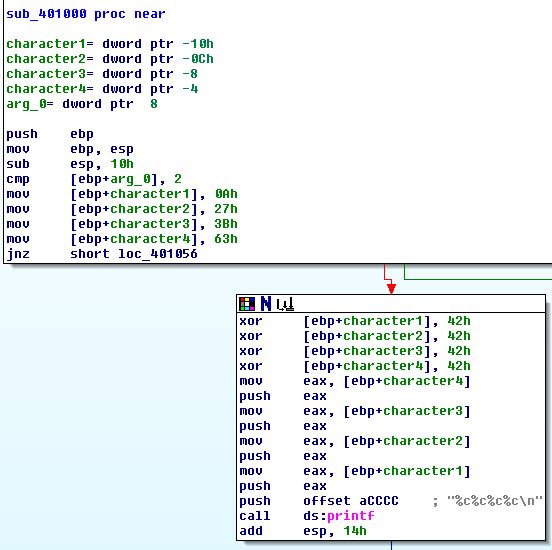
Now it should be a little clearer what’s going on. First, the stack gets set up with a base pointer, and 16 bytes (10h) are set aside for local variables:
push    ebp
mov     ebp, esp
sub     esp, 10h
Next, the first and only argument to the function, arg_0 is compared with 2,
cmp [ebp+arg_0], 2
and our four characters are given initial values:
mov     [ebp+character1], 0Ah
mov     [ebp+character2], 27h
mov     [ebp+character3], 3Bh
mov     [ebp+character4], 63h
These values, 0a 27 3b 63 don’t correspond to any obvious ASCII string (odd…)
Next, we have a jump conditional:
jnz     short loc_401056
111

the four `mov` operations don't affect the `cf` flag, so this short jump happens only if `arg_0` is not `2`. If `arg_0` *is* `2`, we move into the `printf` setup path. It looks like we perform some bitwise operations (`xor` each character by `42h`). If `arg_0` is any other value, we exit the function:

```C-ObjDump
loc_401056:
xor     eax, eax
mov     esp, ebp
pop     ebp
retn
Putting it all together
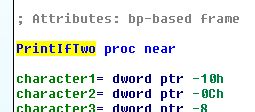
Okay, so static analysis of this function tells us that it takes a value, and if that value is 2, we print four characters. If not, we exit. Let’s name the function PrintIfTwo by selecting its current name, sub_401000, and pressing n:
Now that our function is named, let’s see where it’s getting called. With PrintIfTwo still selected, press x. It seems that it’s only called from one location, so select it.
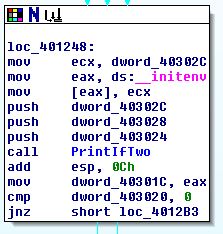
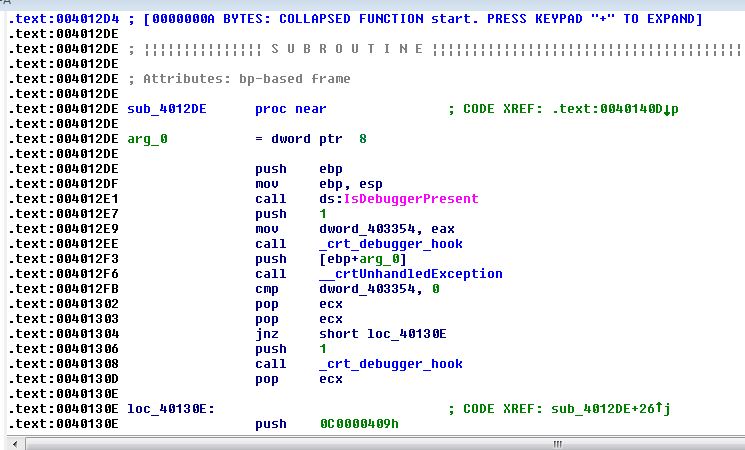
It turns out that __initenv is the last function that the C Runtime invokes before handing off control to our code. Our JumpIfTwo function takes one argument, so we are only interested in the last variable to get pushed onto the stack just before our call: dword_403024. Let’s rename this PrintIfTwoArgument and press x again to see where this variable is set.
The only other function calling PrintIfTwoArgument is sub_401124+2b. Let’s navigate there and see what’s going on:
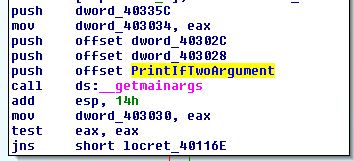
__getmainargs is a C Runtime call that–you guessed it–gets the main arguments:
int __getmainargs(
	int * _Argc,
	char *** _Argv,
	char *** _Env,
	int _DoWildCard,
	_startupinfo * _StartInfo);
So our argument is argc, the number of tokens given at the command line (including the name of the binary!)
Dynamic analysis
Let’s go back and try running the program with one argument:
reversing-demo.exe foo
Hey!
Yahtzee!
Notice that it wouldn’t work with more than one argument (more than two tokens):
reversing-demo.exe
reversing-demo.exe foo bar
reversing-demo.exe foo bar bas
Wrapping up
Even for this exceedingly simple binary, the reverse engineering process took us through a lot of steps. Nugging through assembly is rough going, but it can be made bearable through the use of smart tools like IDA (and, of course, MSDN).
It’s really simple to get started reversing on your own! Write your own programs (or take the programs of others) and try to figure out how it does what it does.
Source
#include "stdio.h"

int main(int argc, char *argv[]) {
	volatile a = 0x0a;
	volatile b = 0x27;
	volatile c = 0x3b;
	volatile d = 0x63;
	if (argc == 2) {
		a ^= 0x42;
		b ^= 0x42;
		c ^= 0x42;
		d ^= 0x42;
		printf("%c%c%c%c\n", a, b, c, d);
	}
	return 0;
}
Obtaining the source
The project is available on Github. To clone, simply issue the following command:
git clone git@github.com:JLospinoso/ReverseEngineering.git
The PDB is available here.